.png?width=226&name=HES%20logo_vertical_RGB%20(1).png)
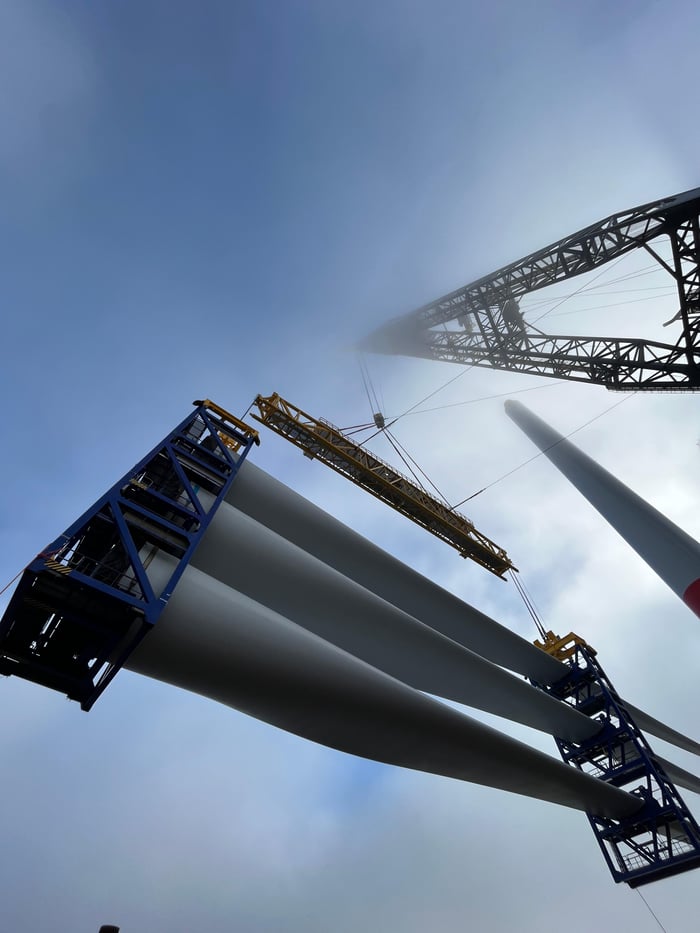
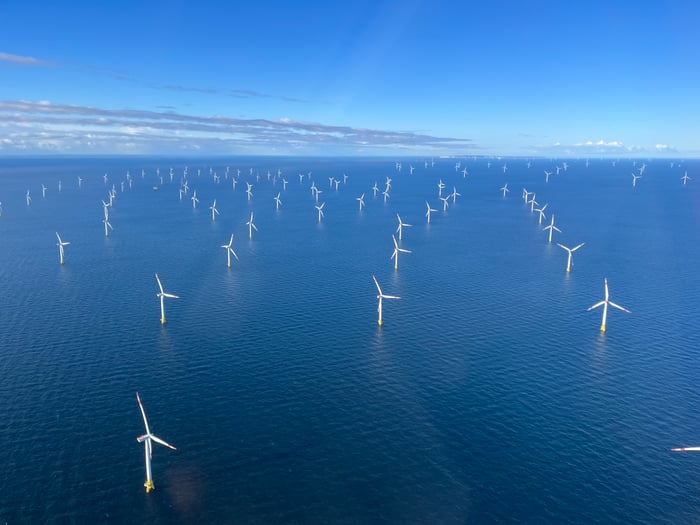
The global energy transition needs offshore wind, but how can we de-risk projects?
At HES, we believe that developing realistic, robust, and ultimately cost-effective construction strategies at an early phase is essential for the offshore wind industry's success.
Improving projects
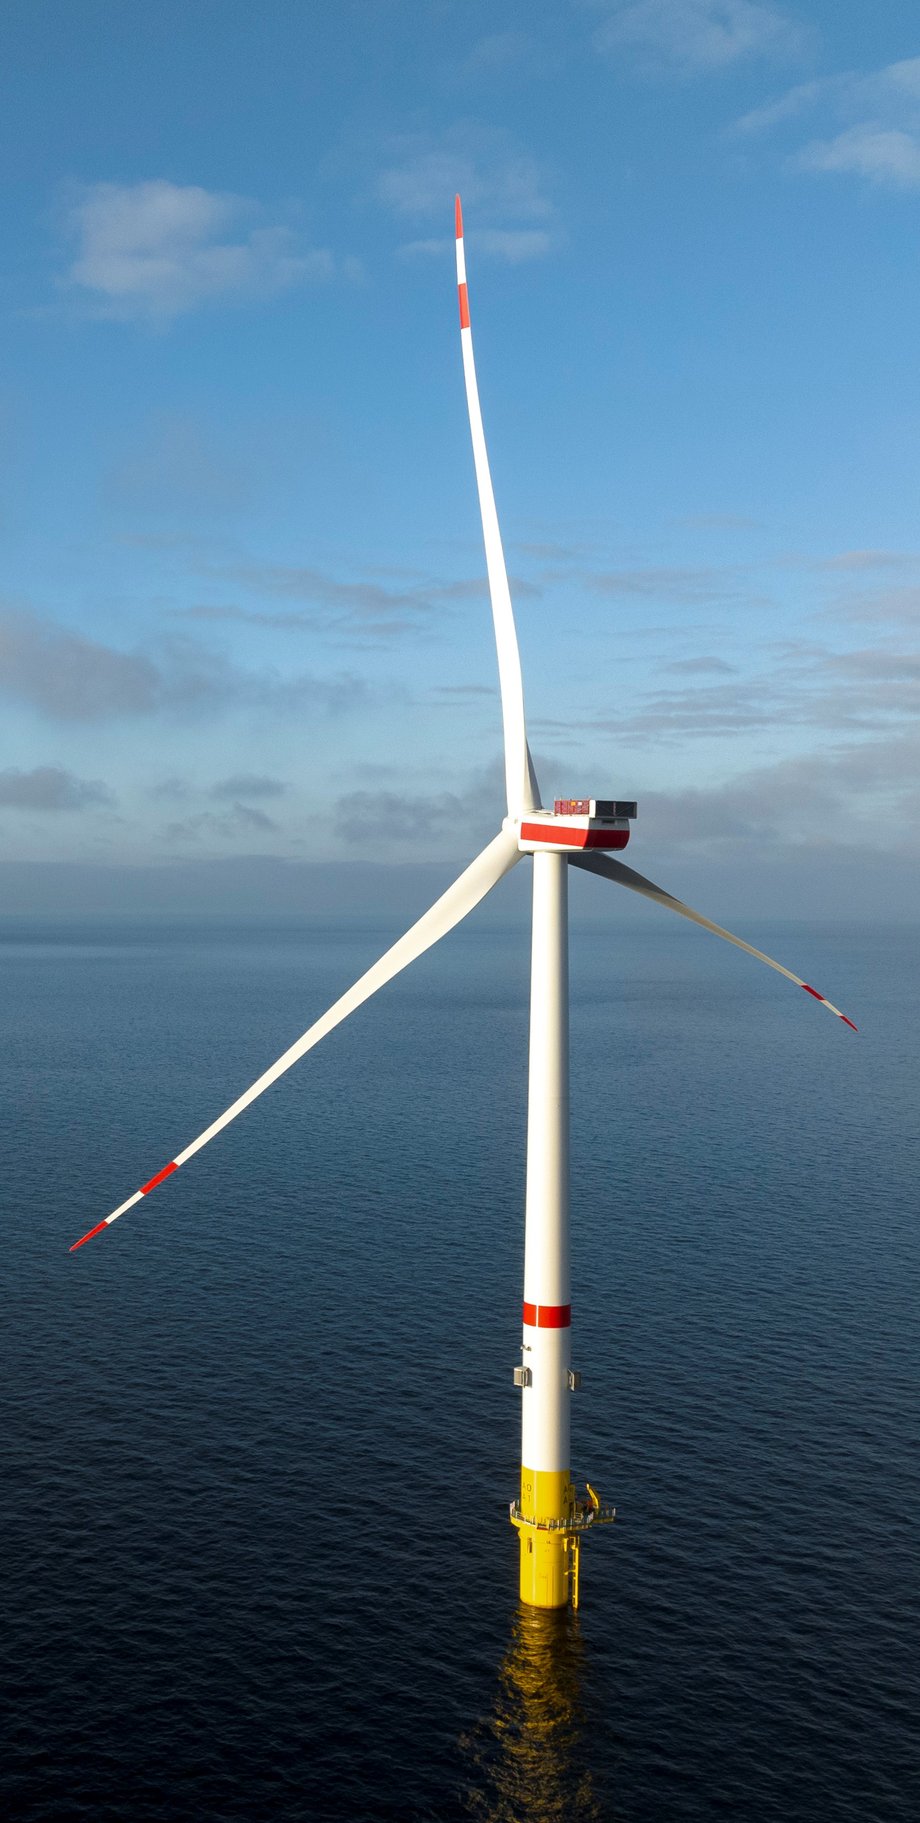
We help clients reduce project duration, costs, and weather downtime from the early-bid phase to commissioning.
Providing Insights
We provide insights on construction duration, costs, risks, and critical operations using our advanced logistical simulation software Metis.
Optimised Strategy
By analysing the project durations, costs, and risks, we optimise project execution strategies to provide our clients the best chance for project completion in a cost-effective and timely manner.


/People%20for%20job.jpg?width=600&name=People%20for%20job.jpg)